Automatically name color tokens
Here's a summary of the dataflow graph:
-
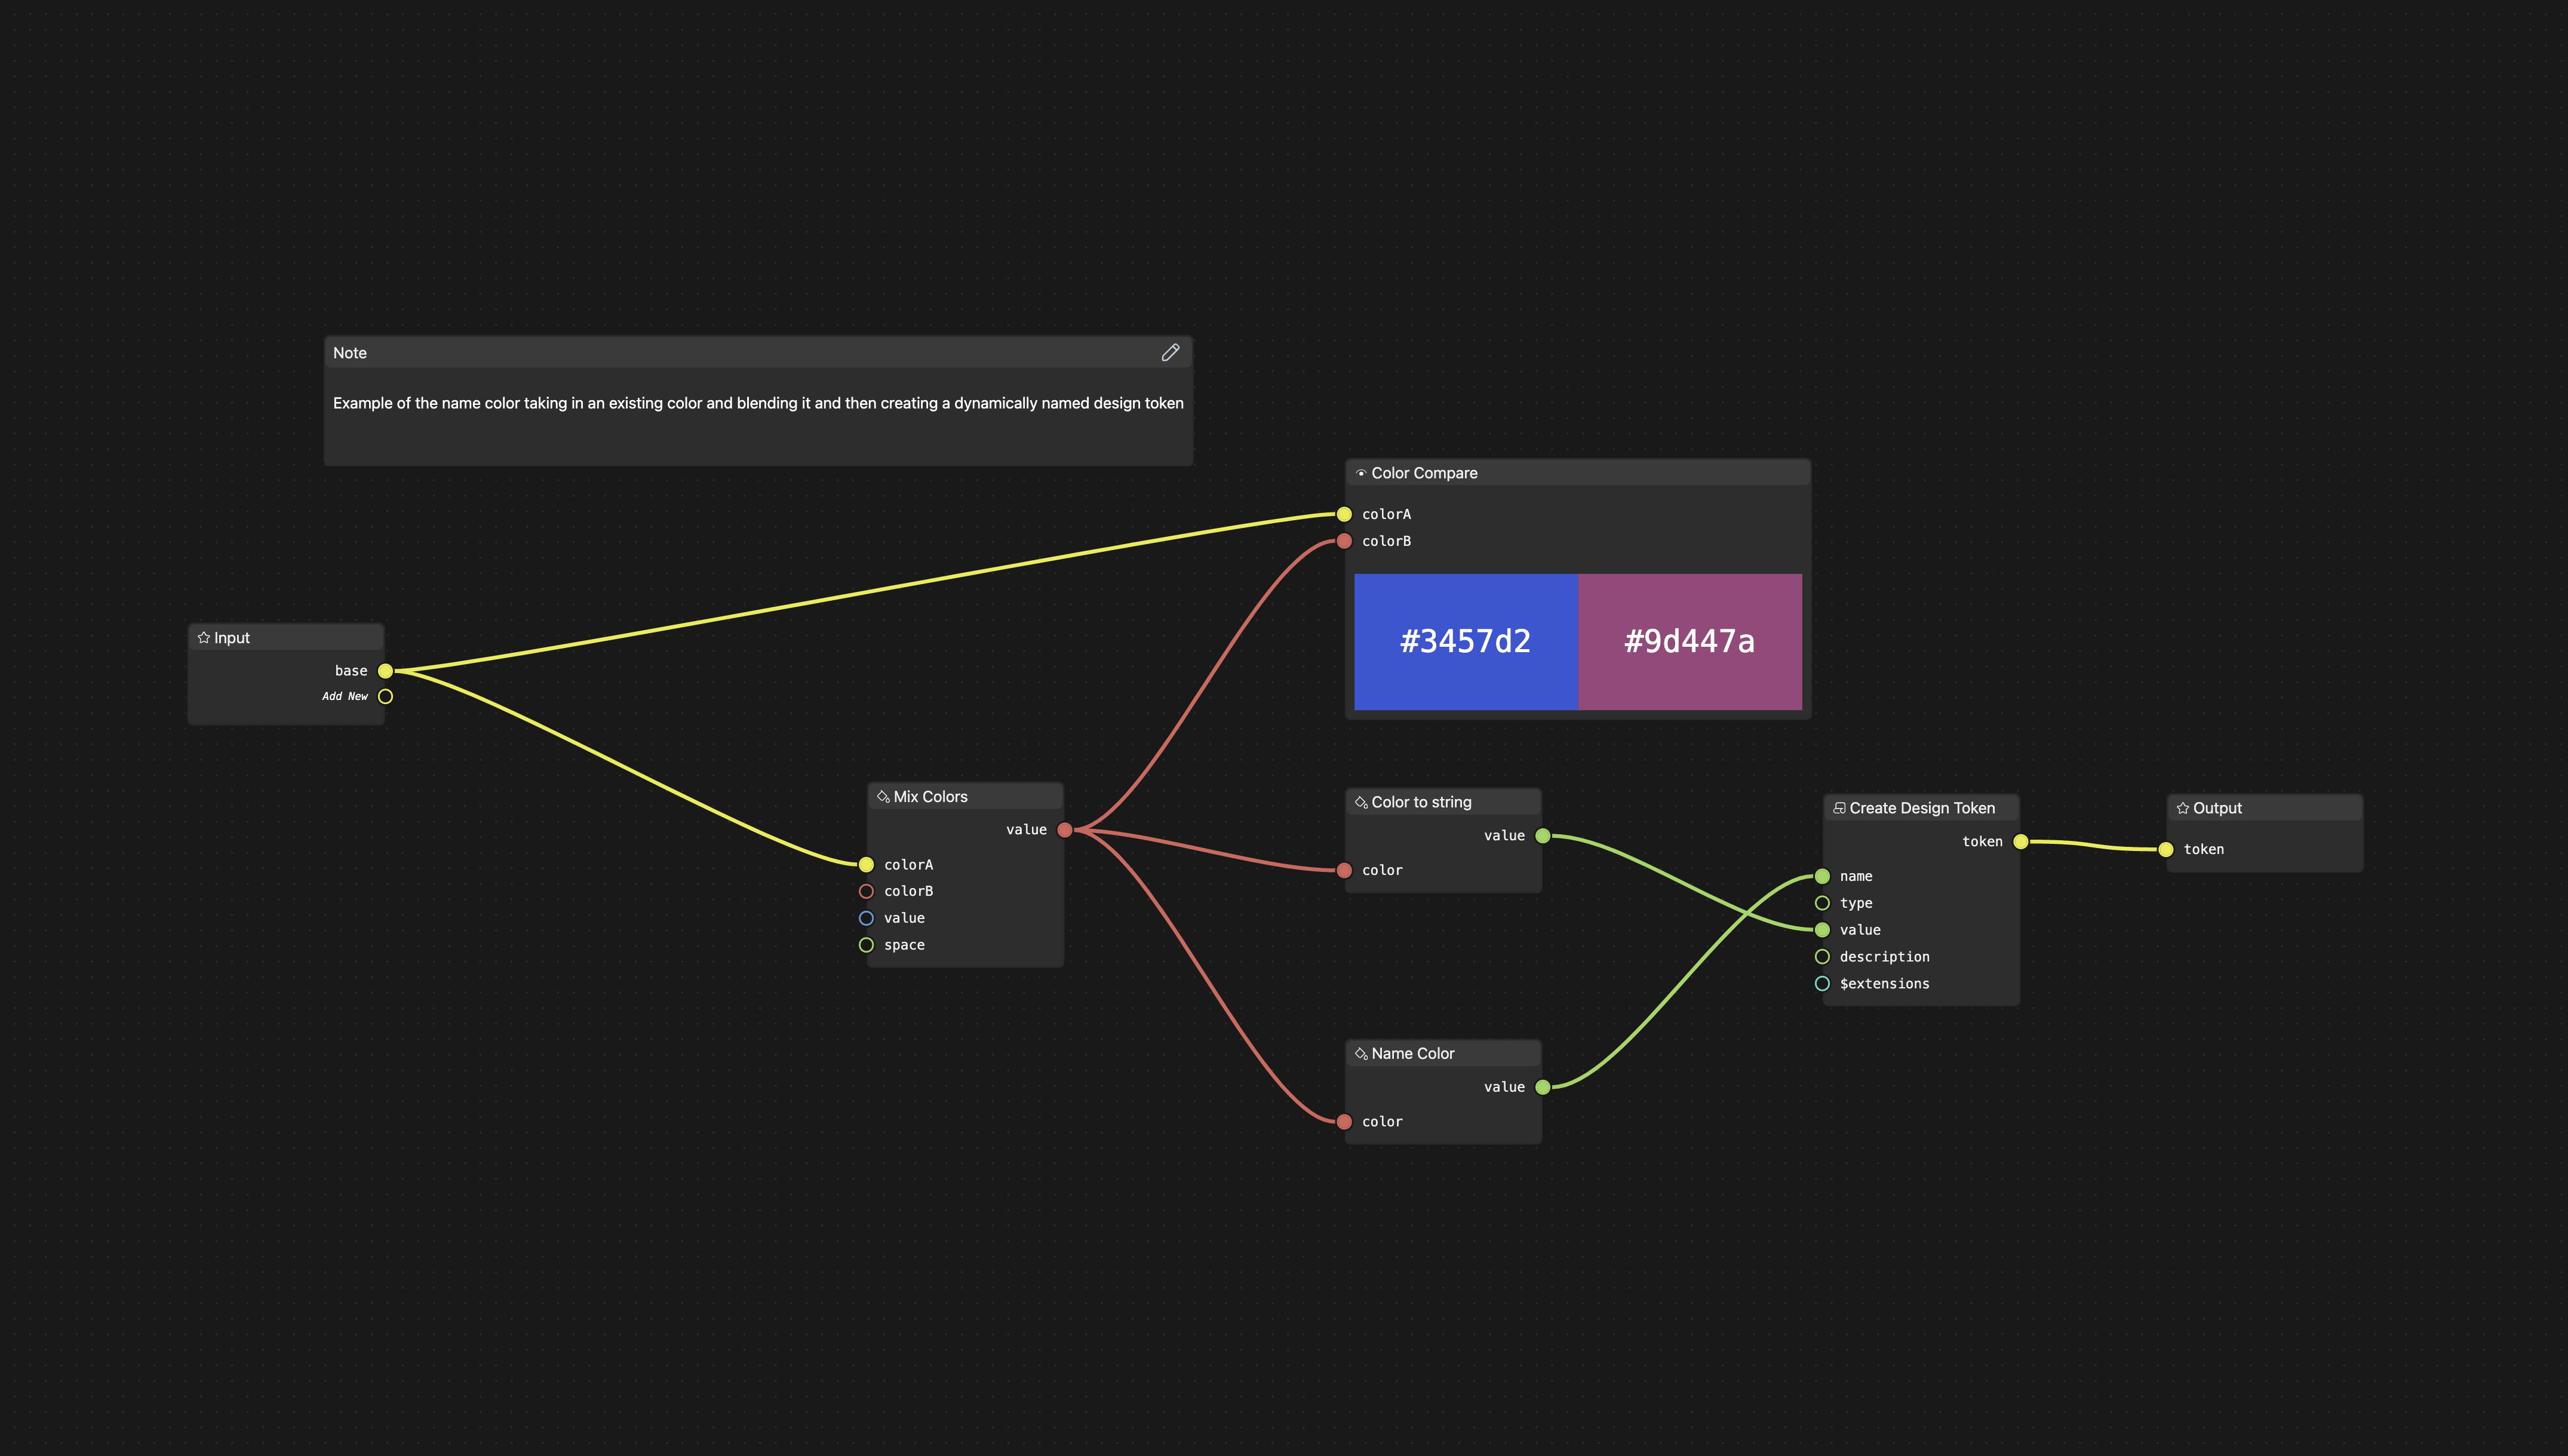
Input and Color Mixing: The graph starts with a generic input node providing a base color (RGB: 0.204, 0.341, 0.824). This color is then mixed with another color (RGB: 0.788, 0.141, 0.141) using a color mix node, with a 50% mix value.
-
Color Comparison: The original input color and the mixed color are compared using a color compare node, allowing visual inspection of the difference.
-
Color Naming and Conversion: The mixed color is passed through a color name node, which likely assigns a name based on its properties. The color is also converted to a hexadecimal string representation.
-
Token Creation: A design token is created using the color name "mediumvioletred" and the hexadecimal color value "#9d447a". This token is defined as a color type.
-
Output: The created design token is connected to an output node, making it available for use in other systems or processes.
Key Insights:
- The graph demonstrates a process of creating a named color token from a mix of two colors.
- It showcases color space conversions (sRGB to LAB) and different color representations (RGB, LAB, Hex).
- The workflow is dynamic, allowing for changes in the input color to propagate through the entire process, potentially creating different color tokens based on the input.
- There's a balance between automated processes (color mixing, naming) and manual input (defining token type and structure).
This graph represents a sophisticated color token generation system that could be part of a larger design system or token management toolkit.